1. 손글씨 데이터셋
from sklearn.datasets import load_digits
digits = load_digits()
digits.keys()
dict_keys(['data', 'target', 'frame', 'feature_names', 'target_names', 'images', 'DESCR'])
import matplotlib.pyplot as plt
_, axes = plt.subplots(2,5, figsize=(14,8))
for i, ax in enumerate(axes.flatten()):
ax.imshow(data[i].reshape((8,8)), cmap='gray')
ax.set_title(target[i])

2. 스케일링(Scaling)
* 데이터를 특정한 스케일로 통일하는 것
* 다차원의 값들을 비교 분석하기 쉽게 만들어주며, 자료의 오버플로우나 언더플로우를 방지하여 최적화 과정에서의 안정성 및 수렴 속도를 향상시킬 수 있다
* 데이터를 모델링하기 전에 거치는 것이 좋음
2-1. 스케일링의 종류
* StandardScaler : 평균과 표준편차를 사용
* MinMaxScaler : 최대, 최솟값이 각각 1과 0이 되도록 스케일링
* RobustScaler : 중앙값과 IQR값사용
from sklearn.preprocessing import StandardScaler, MinMaxScaler, RobustScaler
movie = {'naver' : [2, 4, 6, 8, 10], 'netflix' : [1, 2, 3, 4, 5]}
movie = pd.DataFrame(movie)
movie
min_max_scaler = MinMaxScaler()
min_max_scaler = min_max_scaler.fit_transform(movie)
min_max_scaler
array([[0.  , 0.  ],
       [0.25, 0.25],
       [0.5 , 0.5 ],
       [0.75, 0.75],
       [1.  , 1.  ]])
pd.DataFrame(min_max_scaler, columns=['naver', 'netflix'])
navernetflix01234
| 0.00 | 0.00 |
| 0.25 | 0.25 |
| 0.50 | 0.50 |
| 0.75 | 0.75 |
| 1.00 | 1.00 |
2-2. 정규화(Normalization)
* 값의 범위(Scale)을 0 ~ 1 사이의 값으로 바꿔주는 것
* 학습 전에 Scaling을 하는 것
* 머신러닝, 딥러닝에서 Scale이 큰 Feature의 영향이 비대해지는 것을 방지
* scikit-learn에서 MinMaxScaler 사용
data[0]
scaler = MinMaxScaler()
scaled = scaler.fit_transform(data)
scaled[0]
array([0.        , 0.        , 0.3125    , 0.8125    , 0.5625    ,
       0.0625    , 0.        , 0.        , 0.        , 0.        ,
       0.8125    , 0.9375    , 0.625     , 0.9375    , 0.3125    ,
       0.        , 0.        , 0.1875    , 0.9375    , 0.125     ,
       0.        , 0.6875    , 0.5       , 0.        , 0.        ,
       0.26666667, 0.75      , 0.        , 0.        , 0.5       ,
       0.53333333, 0.        , 0.        , 0.35714286, 0.5       ,
       0.        , 0.        , 0.5625    , 0.57142857, 0.        ,
       0.        , 0.25      , 0.6875    , 0.        , 0.0625    ,
       0.75      , 0.4375    , 0.        , 0.        , 0.125     ,
       0.875     , 0.3125    , 0.625     , 0.75      , 0.        ,
       0.        , 0.        , 0.        , 0.375     , 0.8125    ,
       0.625     , 0.        , 0.        , 0.        ])
2-3. 표준화(Standardization)
* 값의 범위(Scale)를 평균0, 분산 1이 되도록 바꿔주는 것
* 학습 전에 Scaling 하는 것
* 머신러닝, 딥러닝에서 Scale이 큰 Feature의 영향이 비대해지는 것을 방지
* 정규분포를 포준정규분포로 변환하는 것과 같음
* scikit-learn에서 StandardScaler 사용
from sklearn.model_selection import train_test_split
X_train, X_test, y_train, y_test = train_test_split(scaled, target, test_size=0.2, random_state=2024)
X_train.shape, X_test.shape, y_train.shape, y_test.shape
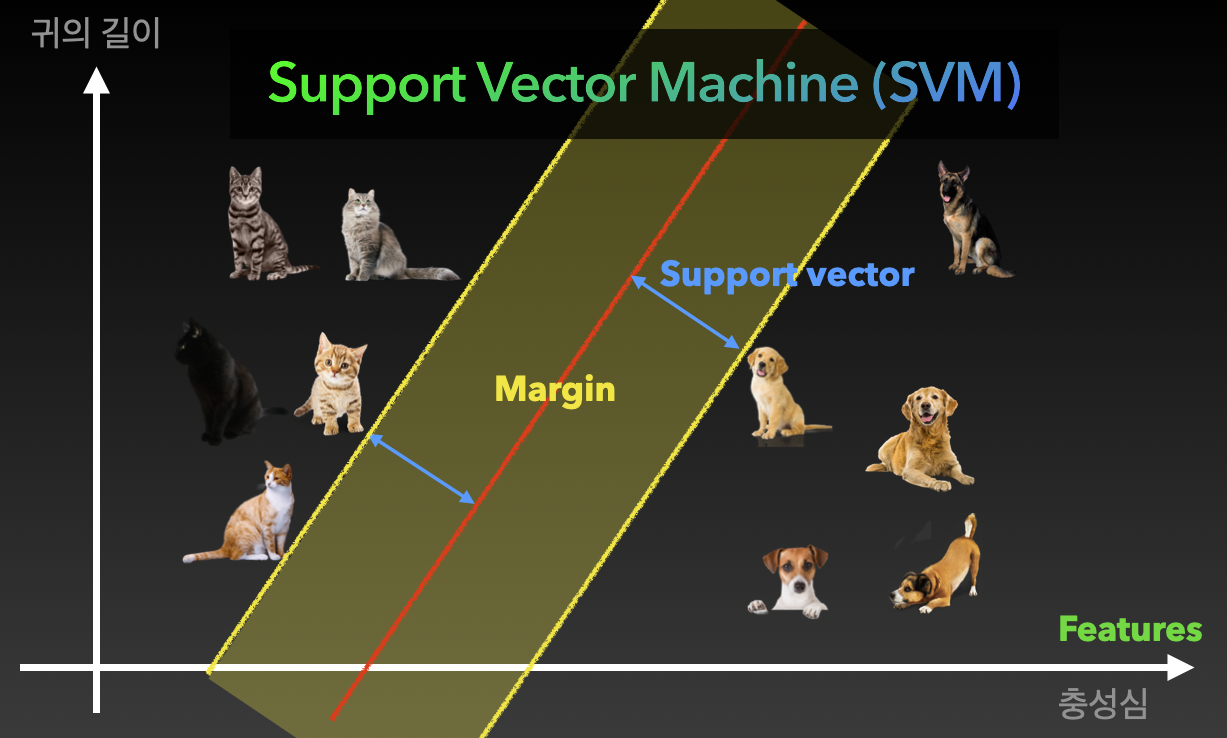
3. Support Vector Machine(SVM)

* 두 클래스로부터 최대한 멀리 떨어져 있는 결정 경계를 찾는 분류기
* 특정 조건을 만족하는 동시에 클래스를 분류하는 것을 목표로 함
from sklearn.svm import SVC
from sklearn.metrics import accuracy_score
model = SVC()
model.fit(X_train, y_train)
y_pred = model.predict(X_test)
accuracy_score(y_test, y_pred)
0.9888888888888889print(y_test[10], y_pred[10]) # 7 7
plt.imshow(X_test[10].reshape(8,8), cmap='gray')
plt.show()

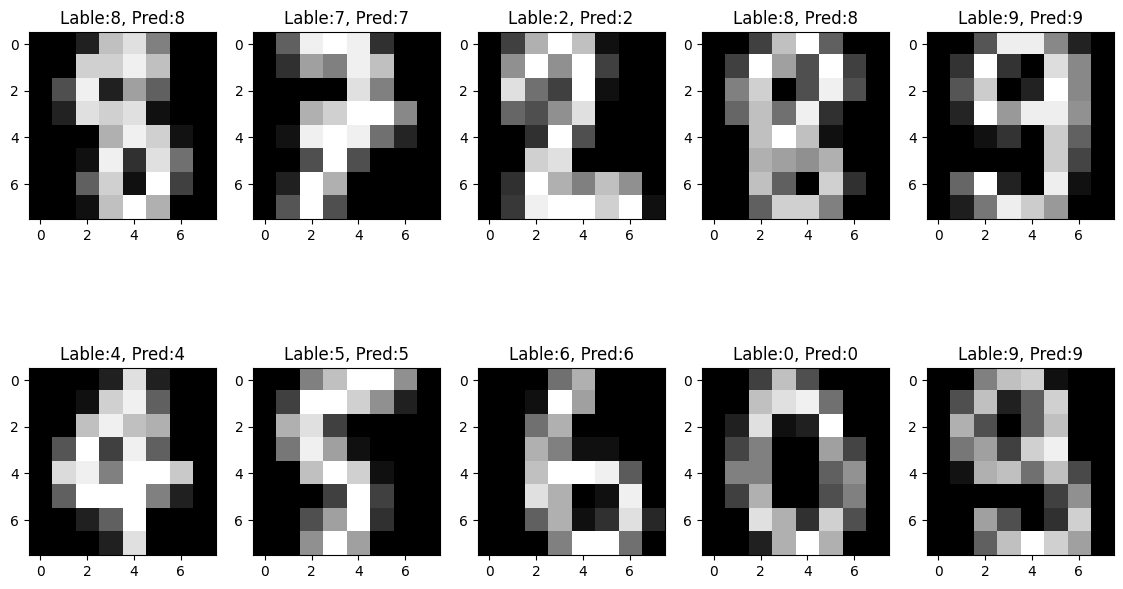
_, axes = plt.subplots(2,5, figsize=(14,8))
for i, ax in enumerate(axes.flatten()):
ax.imshow(X_test[i].reshape((8,8)), cmap='gray')
ax.set_title(f'Lable:{y_test[i]}, Pred:{y_pred[i]}')

'딥러닝과 머신러닝' 카테고리의 다른 글
| lightGBM (2024-06-18) (0) | 2024.06.18 |
|---|---|
| Random Forest, 하이퍼파라미터, Feature Importances (0) | 2024.06.17 |
| Logistic Regression(2024-06-12) (1) | 2024.06.12 |
| Linear Regression, MSE, MAE, RMSE(2024-06-11) (0) | 2024.06.11 |
| 타이타닉 데이터셋(2024-06-10) (0) | 2024.06.10 |


